
Newfoundland and Labrador, Canada’s easternmost province, has a population of just below 500,000 people. It is known for its unique economy driven by its rich natural resources. If you’re considering a move or career change, understanding the earning potential is crucial. This article will focus specifically on the average wage in Newfoundland and Labrador, providing a broad overview of salaries in the province by industry, occupation, and location.
What is the Average Salary in Newfoundland and Labrador?
According to Statistics Canada, the average hourly wage in Newfoundland and Labrador in September 2025 is $33.85 ($1,320.28 per week) (latest data). The median salary in Newfoundland is slightly lower at $1,141.50 per week.
Salaries in Newfoundland and Labrador tend to be lower than the national average. In September 2025, the average hourly wage across Canada is $36.78 ($1,346.97 per week).
Looking more closely at the monthly data, we can see how both the average and median weekly wages in Newfoundland and Labrador fluctuated over the course of the year:
| Month | Average Weekly Wage | Median Weekly Wage |
|---|---|---|
| June 2024 | 1,280.31 | 1,100.00 |
| September 2024 | 1,292.37 | 1,123.20 |
| October 2024 | 1,285.69 | 1,120.00 |
| November 2024 | 1,275.20 | 1,080.00 |
| December 2024 | 1,302.63 | 1,120.00 |
| January 2025 | 1,300.70 | 1,120.00 |
| February 2025 | 1,304.77 | 1,125.00 |
| May 2025 | 1,283.14 | 1,080.00 |
| July 2025 | 1,282.15 | 1,080.00 |
| September 2025 | 1,320.28 | 1,141.50 |
The table shows that wages in Newfoundland and Labrador stayed steady over the year. While the job market seems stable, pay is still a bit lower than the national average. The difference between average and median wages means some people earn more, but many earn less.
What Factors Influence Wages in Newfoundland and Labrador?
What determines the salaries associated with particular jobs and industries in Newfoundland and Labrador? Here are the five key factors:
- Experience and education – Higher skill levels and years of experience tend to increase earning potential. Fields like healthcare and technology require specialized training and education.
- Industry demand – When certain industries are growing or facing labour shortages, salaries tend to rise. For example, construction wages have increased amidst skilled worker shortages.
- Location – As noted, larger urban centers like St. John’s tend to pay higher wages across most occupations. Specific industries drive wages in different towns.
- Unionization – Newfoundland and Labrador has higher-than-average union membership at 39%, which helps push up salaries through collective bargaining.
Understanding these factors provides context on what impacts average salaries in N.L. for different professions.
What are the Highest Paying Cities in Newfoundland and Labrador?
While St. John’s has the highest salaries overall, other cities and towns across Newfoundland and Labrador also offer strong earnings potential. Wages are often tied to key industries like mining, oil and gas, public services, and forestry. Learn more below:
St. John’s
As the capital and largest city in the province, St. John’s provides the highest wages, with an average of approximately $55,000 to $70,000 per year across occupations. Major industries like finance, healthcare, education, government services, and oil and gas operations located in and around St. John’s boost salaries for professionals in these sectors.
Mount Pearl
Bordering St. John’s, the city of Mount Pearl has an average annual salary of around $55,000 to $65,000. Major retail employers like big box stores and auto dealerships, combined with light industrial businesses, contribute to solid earning potential, especially for sales, service and trades jobs.
Conception Bay South
This suburb of St. John’s benefits from its proximity to the capital’s job market. Jobs in trades, transportation, construction, and production offer average salaries of $50,000 – $65,000. The nearby North Atlantic oil refinery has historically provided high-paying jobs, though its operations have faced challenges in recent years.
Corner Brook
As a major port city on the West Coast, Corner Brook offers average annual wages of approximately CAD 50,000 to CAD 60,000. The paper mill and related forestry jobs, as well as public sector and service jobs across retail, healthcare and education, comprise the top industries.
Labrador City
Located in western Labrador, this city of 10,000 residents has average salaries of around $60,000 to $75,000 per year. The economy and higher-than-average wages are driven largely by the iron ore mining sector, which employs thousands of skilled professionals.
Labour Force Estimates for Newfoundland and Labrador by Industry
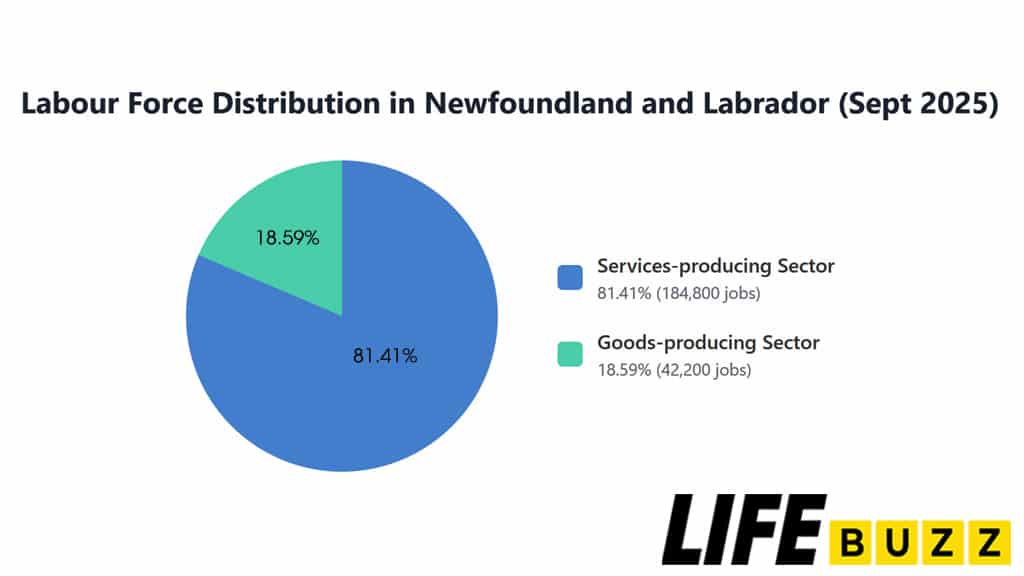
According to Statistics Canada, table 14-10-0063-01, the total labour force across all industries in Newfoundland and Labrador is estimated to be 227,000 persons in 2025. The goods-producing sectors account for 42,200 jobs, while the services-producing sectors occupy 184,800 positions.
Goods-Producing Sectors in Newfoundland and Labrador
Within the goods-producing industries, the breakdown of employment in Newfoundland and Labrador for 2025 is:
- Agriculture: 800 persons
- Forestry, fishing, mining, quarrying, oil and gas: 12,900 persons
- Utilities: 2,200 persons
- Construction: 18,200 persons
- Manufacturing: 8,300 persons
The largest component is the forestry, fishing, mining, quarrying, oil, and gas sector, reflecting the importance of natural resource extraction in the provincial economy. Construction also accounts for a significant number of jobs, which is linked to demand from the mining, oil, and public infrastructure sectors. Manufacturing jobs are concentrated in Corner Brook’s paper mill and other light industries.
Service-Producing Sectors in Newfoundland and Labrador
Looking at the estimated 184,800 jobs in the service sector for 2025, the leading industries are:
- Health care and social assistance: 43,900 persons
- Public administration: 21,500 persons
- Educational services: 19,100 persons
- Retail and wholesale trade: 36,500 persons
- Transportation and warehousing: 12,600 persons
- Accommodation and food services: 13,500 persons
Health care, education, public service and retail trade make up over half of all service sector employment in Newfoundland and Labrador. Transportation jobs support the movement of goods from resource industries, while tourism operators account for positions in accommodation and food services.
That said, natural resources, construction, healthcare, public administration and education represent the major sources of employment across goods and service industries in Newfoundland and Labrador’s estimated 2025 labour force.
What are the Average Salaries by Industry in Newfoundland and Labrador?
There is a wide range of salaries across industries in Newfoundland and Labrador. The goods-producing sectors generally offer higher average wages, while service industry jobs fall on the lower end of the pay scale. Below are the latest data from Statistics Canada, Table 14-10-0063-01, for September 2025:
Average Salaries In Goods-Producing Sectors in NL
The goods-producing industries pay the highest average weekly wages in the province, at $1,837.55 (as of September 2025). The sectors and their associated average weekly salaries are:
- Agriculture – $1,363.17 weekly. Includes fishing, animal production and crop farming.
- Forestry, fishing, mining, quarrying, oil and gas – $2455.43 weekly.
- Utilities – $1,892.32 weekly. Electric power generation, transmission and distribution utilities.
- Construction – $1,595.69 weekly. Building construction, heavy engineering construction and trade contractors.
- Manufacturing – $1,483.37 weekly. Food processing, metal fabrication, machinery and paper manufacturing.
These natural resource-based sectors benefit from Newfoundland and Labrador’s abundance of mineral resources, offshore oil reserves, vast forests, rich fishing grounds and hydroelectric assets.
Average Salaries In Service-Producing Sectors in NL
Average weekly wages in the services-producing sector are $1,202.10 across Newfoundland and Labrador (as of September 2025). The industries and their associated salaries are:
- Wholesale and retail trade – $898.58 weekly. Wholesalers of food, machinery, electronics and other products. Salespersons, managers and support roles in retail stores.
- Transportation and warehousing – $1,514.81 weekly. Trucking, marine transport, air transport and storage services.
- Finance, insurance, real estate and rental and leasing – $1,335.21 weekly. Banking, insurance providers, investment firms and pension funds. Property management, real estate services, and equipment rental.
- Professional, scientific and technical services – $1,868.03 weekly. Lawyers, accountants, architects, engineers and consultants.
- Educational services – $1,372.57 weekly. Primary, secondary and post-secondary teaching institutions.
- Health care and social assistance – $1,217.51 weekly. Hospitals, nursing homes, social services and ambulatory care.
- Information, culture and recreation – $967.09 weekly. Performing arts, promoters, museums and recreation facilities.
- Accommodation and food services – $618.46 weekly. Hotels, restaurants, bars and caterers.
- Other services (except public administration) – $974.24 weekly. This includes repair services, personal care, and religious and civic organizations.
- Public administration – $1,593.54 weekly. Federal, provincial and local government services.
In general, professional services, finance, education, and healthcare offer above-average salaries, while retail, food service, and tourism fall below the provincial wage levels.
Source: Statistics Canada. Table 14-10-0063-01 Employee wages by industry, monthly, unadjusted for seasonality
What are the Average Salaries by Occupation in Newfoundland and Labrador?

Looking at the average salaries by occupation reveals a wide range of earning potential in Newfoundland and Labrador. Nine of the highest-paying jobs on an annual basis include:
- Senior managers – financial, communications and other business services: ~ $163,633
- Engineering managers: ~ $125,008
- Computer and information systems managers: ~ $124,800
- Petroleum engineers: ~ $125,008
- Specialists in clinical and laboratory medicine: ~ $302,189
- Specialists in surgery: ~ $425,933
- General practitioners and family physicians: ~ $204,492
- Dentists: ~ $180,000
- Engineer officers, water transport: ~ $68,848
These occupations in management, engineering, healthcare and natural resources tend to offer the strongest earnings potential.
Twelve of the lowest-paying occupations on an annual basis are:
- Cashiers ~ $32,448
- Food Counter Attendants ~ $32,448
- Hairstylists ~ $32,448
- Taxi Drivers ~ $32,448
- Labourers in fish and seafood processing: ~ $35,817
- Nursery and greenhouse labourers: ~ $32,448
- Food and beverage servers: ~ $32,448
- Tour and travel guides: ~ $35,880
- Cooks: ~ $33,280
- Restaurant and food service managers: ~ $41,600
- Shippers and receivers: ~ $37,440
- Fish and seafood plant workers: ~ $35,464
Jobs in food services, tourism, retail, and manual labour tend to fall on the lower end of the pay scale. However, tipped positions like food and beverage servers can sometimes earn more with gratuities.
To summarize, Newfoundland and Labrador offer high earning potential in fields like engineering, healthcare, natural resources, and management. However, customer service, food services, and manual labour roles tend to have lower salaries.
Source: Government of Canada, Wages in Newfoundland and Labrador
What are the Salary Growth Trends in Newfoundland and Labrador?
Statistics Canada, Table 14-10-0064-01 data shows that average weekly wages for all employees in Newfoundland and Labrador have increased over the past two decades:

- In 2002, the average weekly wage was $567.79. This grew moderately through the 2000s.
- By 2008, the average wage reached $753.14 per week. However, wage growth then stagnated due to the 2009 recession.
- From 2011 to 2013, average weekly earnings rose from $857.11 to $965.22 as the economy recovered. But growth levelled off again between 2013 and 2016.
- In 2017, the average weekly wage finally surpassed $1,000, hitting $1,015.32 that year.
- From 2017 to 2019, wage growth was modest, with the 2019 average reaching $1,027.24.
- A spike occurred in 2020, with average weekly wages rising to $1,070.47, likely due to the impacts of the pandemic.
- The momentum continued into 2021 and 2022, with average weekly earnings climbing to $1,218.75 in 2023 and $1,273.83 in 2024.
Compared these data to other provinces, Newfoundland and Labrador ranks in the middle for average weekly wages:
- Alberta: $1,377.29
- Ontario: $1,339.01
- British Columbia: $1,336.98
- Nova Scotia: $1,139.62
Newfoundland and Labrador’s average salary is higher than that of neighbouring Atlantic provinces like Nova Scotia and New Brunswick, but lower than that of leading western provinces such as Alberta. The dominance of natural resource industries helps boost wages. However, a lack of major urban centers and reliance on seasonal industries suppresses wage growth relative to provinces like Alberta.
Source: Statistics Canada. Table 14-10-0064-01 Employee wages by industry, annual
Putting the Numbers in Context: Cost of Living
A salary figure is only half the story. The actual value of your income depends on the local cost of living. While wages in NL may be lower than in provinces like Alberta or Ontario, the cost of living, particularly housing, is often significantly more affordable.
- Housing: Outside of the St. John’s metropolitan area, housing and rental prices are substantially lower than in Canada’s major urban centers. This is one of the biggest financial advantages of living in the province.
- Taxes: Newfoundland and Labrador has a progressive income tax system and one of the highest Harmonized Sales Tax (HST) rates in Canada (15%). This can impact your disposable income.
- Other Costs: Groceries, transportation, and utilities can sometimes be higher due to the province’s island geography and reliance on shipping.
Summary
In summary, average salaries in Newfoundland and Labrador remain below the national level; however, they offer strong earnings potential in certain growing industries and occupations. Natural resources, construction, healthcare, technology and skilled trades have emerged as high-paying fields.
Looking ahead, offshore oil activity, mining, greenhouse gas projects, and renewable energy present a positive outlook. Continued public and private investment will be key for future job and wage growth. With expanded training initiatives, the province can build the skilled workforce needed to fill in-demand roles.
If you’re thinking about working in Newfoundland and Labrador, things like where you live, what jobs are in demand, and your skills can affect how much you earn. Knowing the average pay in each industry and job type, along with where jobs are growing, can help you better understand the job market.
FAQs
What sectors pay the highest salaries in Newfoundland and Labrador?
The goods-producing sectors like mining, oil and gas extraction, forestry, fishing and utilities tend to have the highest paying jobs in Newfoundland and Labrador. The finance, professional services and healthcare sectors also offer above average salaries.
What are the lowest paying jobs in Newfoundland and Labrador?
The lowest salaries are found in sectors like retail, tourism, food service and customer service. Jobs like cashiers, servers, tour guides, cooks and food counter attendants tend to be lower wage occupations.
How do salaries in Newfoundland and Labrador compare to other provinces?
Newfoundland and Labrador has middle of the pack salaries compared to other provinces. It ranks higher than the Atlantic provinces but lower than leading western provinces like Alberta.
Why are wages lower in Newfoundland and Labrador than other parts of Canada?
Factors like fewer major urban centers, more seasonal and resource based industries, higher unemployment and greater reliance on transfer payments from the federal government contribute to lower wages on average compared to provinces with more diversified economies.
Which city has the highest salaries in Newfoundland and Labrador?
St. John's, as the largest city and capital of the province, has the highest salaries on average across occupations compared to other areas of Newfoundland and Labrador.
How much do registered nurses make in Newfoundland and Labrador?
According to government data, the median hourly wage for registered nurses in Newfoundland and Labrador is $41.24, which translates to an average annual salary of around $85,000.
What benefits or premiums are added on top of base salaries in Newfoundland and Labrador?
Some common benefits and premiums on top of base wages include overtime, vacation pay, holiday pay, life and disability insurance, health benefits, pensions, and bonus or profit-sharing plans for some employees.
How does population aging impact average salary trends in Newfoundland and Labrador?
The province has an older population demographic, resulting in more retirees leaving the workforce. This tightens labor supply for certain occupations, which can drive up bargaining power and wages.
How much do entry-level jobs pay in Newfoundland and Labrador?
Entry level positions like retail salespersons, food counter attendants, kitchen helpers, and laborers typically pay minimum wage or just above, which ranges from $13.60 to $15 per hour. However, some entry level trade apprenticeships pay over $20 per hour.
Which occupations have the most bargaining power for wages in Newfoundland and Labrador?
Jobs like nurses, software developers, engineers, plumbers, electricians, and truck drivers tend to have more leverage to negotiate wages due to high demand and skill requirements.
How can you increase your salary potential in Newfoundland and Labrador?
Pursuing higher education, specialized training and credentials, relocating closer to urban centers, networking, gaining more experience, and negotiating salaries can help maximize earning potential.
Are salaries rising faster than inflation in Newfoundland and Labrador?
In recent years, average wage growth has outpaced national inflation rates, indicating real wage gains for many workers. But inflation-adjusted incomes can fluctuate year-over-year.
